Technical Assessment
A technical assessment was undertaken for the three scenarios illustrated in figure 1, detailed analysis of calculations to reach the outputs of this page are found within the "methodology" section of the website, and further detail provided in the excel sheet downloadable resources.

Figure 1- The three Scenarios provided as pathways to decarbonise the heat supply to the DH network. The green button beneath each scenario links to its respective technical assessment.
Scenario 1
The technical assessment of Scenario 1 invloved understanding the river properties, sizing the heat pump and then consideration of placement and piping pathways through the city centre.
RIVER PROPERTIES
FLOW RATE
To begin the design of the WSHP system, an analysis of the river properties of the river Clyde had to be undertaken. Figure 2 below shows the daily flow rates throughout 2018 in m3/s. The flow rate varies greatly throughout the year which is likely due to the heavy rainfall and high winds experienced throughout the winter months in Scotland. In summer the flow rate is significantly less.
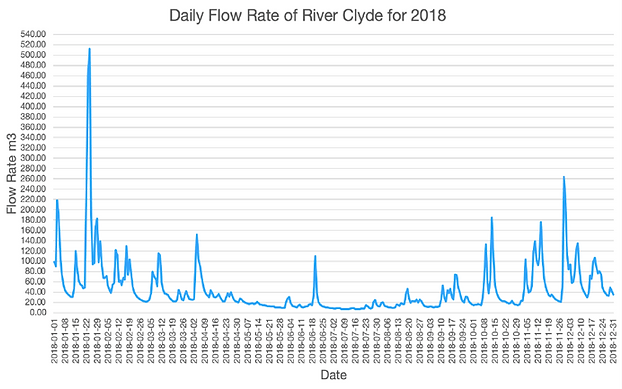
Figure 2- Daily Flow Rate (m3/s) of River Clyde for 2018. Information source (SEPA)
Figure 3 illustrates a graph that has been taken from the National River Flow Archive (NRFA) website and shows the flow exceedance curve over a period from 1963 to 2019 (NRFA, 2021). This type of graph is useful as it displays the data in accordance with the percentage of time that a flow rate is exceeded (Lyden, 2015).
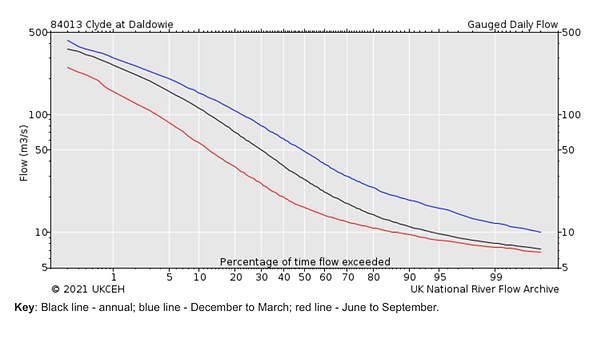
Figure 3- The flow exceedance curve of the Clyde river from 1963 to 2019. (NRFA, 2021)
For 99% of the time, there is a flow rate of 8m3/s which is very conservative given the higher flow rates in winter. Taking into consideration the 10% extraction limit imposed by the Scottish Environmental Protection Agency (SEPA), the equation detailed in methodology was used to determine the available heat to be removed from the river:
𝑄 = 𝑚̇ 𝜌 𝐶𝑝 ∆𝑇
𝑄 = the heat which is drawn into the heat pump.
𝑚̇ = the mass flow of water (0.8m3/s).
𝜌 = the density of the fluid water (1000kg/m3).
𝐶𝑝 = the heat capacity of the water (4200 J/kgK).
∆𝑇 = the temperature difference between the water entering and exiting the heat pump (3°C).
The heat available was determined to be 10.1MW using a ∆𝑇 of 3°C in line with SEPA regulations (SEPA, 2015).
SEPA states that a project will require a ‘Complex License’ if water is abstracted in excess of 2000m3 per day. As this system will abstract 69,120m3 daily, a Complex License will be required (SEPA, 2015).
WATER TEMPERATURE
The monthly maximum and minimum water temperatures for the River Clyde can be seen in figure 4. This shows the minimum temperature is not likely to drop below 6°C, therefore making the River Clyde a prime candidate for a WSHP as freezing of the system is unlikely to occur.

Figure 4 - The Maximum and Minimum Temperatures (degrees celcius) for the River Clyde, broken down by month.
SIZING HEAT PUMP
Taking into consideration the amount of heat available from the river, a 9MW WSHP system has been designed to meet the demand of the university. The heat pumps have been sized to provide 57% of the Design Days peak demand. Optimisation of the system can be seen in the table 1 and figure 5 below. Each heat pump is 3MW and together are able to provide 96% of the annual energy demand of the university. The remaining demand that is seen during the coldest months of the year will be met by a 200,000L thermal store. This thermal store will be charged when there is low heating demand, allowing it to be implemented when needed.
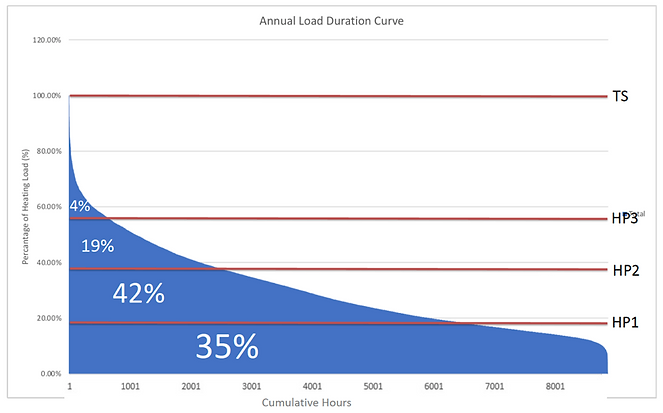
Figure 5 - Annual Load Duration Curve for Scenario 1, showing the percentage of heating load met by each of the Heat Pumps and the Thermal Store.
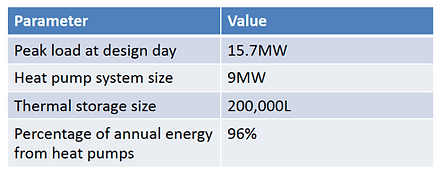
Table 1 - Parameters of Scenario 1
SIZING THERMAL STORE
It was necessary to implement a thermal store into the heating system as this allows the heat pumps to provide a steadier output at a smaller size, therefore also greatly reducing costs (Lyden, 2015). The store was sized at 200,000L as per CIBSE Guide B1: Heating, using the following equation as described in the methodology (CIBSE, 2016):
-
M: Mass of the stored water
-
Cp= 4.18 kJ/kgK
-
Θws – Θw1 = 30° C
-
Trec= 3600s
-
Φ= 7MW
For further detailed sizing and assessment of the heat pump please refer to the available download "WSHP excel model"
Upon completion of the sizing of the Water Source Heat Pump, the next considerations were those of logistics; water pump location on the Clyde, heat pump location within Campus and trenching and piping through the city centre.
TRENCHING AND PIPING
AutoCAD was used to assess the potential routes through the city centre for trenching. The proposed pipework route is shown in the map in figure 6 and runs from the River Clyde along High Street and George Street and ends at a car park on Martha Street. This is the proposed location of the three heat pumps and is marked on the map with a blue triangle. The yellow star on the map is the proposed location of the main circulation pump and where the inlet and outlet pipes will enter the river.


Figure 6 - Map detailing the proposed location of water pump on the river clyde denoted by the yellow star, the route of piping shown in black and the proposed location of the 3 Heat Pumps on Campus denoted by a blue triangle.
The route of the pipework is 1485m in length from the river to Martha Street. This route will need to be trenched which will require the appropriate license from the Scottish Government. The diameter of the pipes was determined to be 0.7m using the following equation:
WATER PUMP HOUSING
It is imperative that the plant associated with the system is housed securely. This will be done using recycled shipping containers creating cheap, secure housing. The circulation pump housing will be above the River Clyde on stilts/columns. The design for this is shown in figure 7, the inlet and outlet pipes will also pass through this building. The heat pumps will be housed in a larger shipping container building.
oHeat pump housing 40ft x 56ft x 17ft
oCirculation pump housing 40ft x 16ft x 8.5ft

Figure 7 - Sketches showing design of Heat Pump Housing over the River Clyde, built from repurposed shipping containers.
VALIDATION THROUGH LITERATURE
In order to validate the size of the calculated heat pump, a comparison to case studies of systems currently in operation was made. It was found that the heat pump sized for Scenario 1 is in line with the following heat pumps currently in operation:
oQueens Quay, Glasgow – 5.2MW
oDrammen, Norway – 13.5MW
oVärtan Ropsten, Sweden - 180MW
Scenario 2
RETROFITTING THE CHP
When proposing a retrofit of the CHP & Boilers for suitability for 100% hydrogen fuel, firstly the compatibility of the engine within the CHP was considered. Analysis of the parts within the CHP was undertaken and incompatible parts identified, figure 8 illustrates the parts within the CHP which are compatible and not for hydrogen.
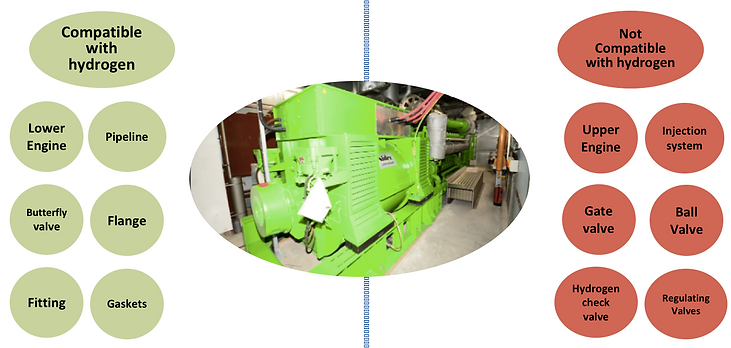
Figure 8 - The CHP engine within Energy Centre of Strathclyde, and the Compatible parts for Hydrogen listed in green, incompatible in red.
As the CHP engine is required for a minor overhaul at 30,000 operating hours or a major overhaul at 60,000 operating hours (roughly 7 years) - Strathclyde CHP is due major overhaul in the year 2025 / 2026. (Clarke Energy, 2021) It is suggested that the retrofit of the CHP to hydrogen suitability would be undertaken within one of the overhauls- when the CHP engine would be down for servicing anyway.
SOURCING THE HYDROGEN.
Three potential sources of hydrogen were assessed; 1) Delivery via trucks, 2) Delivery via the grid and 3) Production onsite via electrolysis.
1) DELIVERY VIA TRUCKS
The hydrogen demands for the CHP and 3 boilers were calculated for 2020 from the half hourly datasheet. This was then used to give an approximate monthly and daily need of hydrogen. Three type of trucks to transport various quantities of hydrogen gas; 900 kg, 600 kg and 300 kg (Brown, 2019) were found. The number of truckloads required to supply the average daily demand were broken down by month, and shown for the various sizes of hydrogen truck in table 2.
Table 2- The Daily Truck deliveries required to supply Hydrogen Demand, broken down by month.

The requirement of the large numbers of trucks makes hydrogen delivery via trucks not a viable option. Limitations within the city centre for maneouvering HGV's alongside concerns of the traffic emissions associated with trucks, particularly with Glasgow City Centre being a low emission zone. This option is disregarded.
For further detail of hydrogen truck delivery assessment please refer to the available download "Hydrogen Excel Model".
2) DELIVERY VIA GRID
Although this would be a desirable option, with the current price of hydrogen at approximately £10/kg, and with an annual consumption of H2 calculated for the system from the invoices to be 1,15 million kg of H2, the annual expenditure would be £11.5 million.
This is also not a readily available technology, there is not adequate Hydrogen supply available for the grid. There are also health and safety limitations, HSE currently only allows up to a 20% blend of Hydrogen through gas networks, higher hydrogen concentrations are posed as a safety risk. However, as projects such as H100 in fife and H21 in Leeds work to prove the safety and feasibility of hydrogen delivery via the grid, it is likely that in the future this may be a viable option. With the price of climate levy's and carbon taxes expected to drive natural gas fuel costs up, and investment in hydrogen technology to drive hydrogen prices down, in the future hydrogen may financially compete with the current system. Predicting the point at which hydrogen fuel may become cost competitive was out of the scope of this project.
3) HYDROGEN PRODUCED ONSITE VIA ELECTROLYSIS
The final pathway considered was that of hydrogen produced onsite via electrolysis. Firstly, as described in the methodology, the demand of the system was used to size the electrolyser unit needed. With selection of a large enough electrolyser unit, it is known that one electrolyser has the capacity to support the system. This creates a viable option for hydrogen source for the Scenario.
SELECTION
The three hydrogen sources were compared and went through a selection matrix, similar to that of the technology selection page, where they were given a probability and impact weighting under 7 criteria;
-
Inefficiency of design
-
Availability of Technology
-
Risk of system failure
-
Spatial Constraints
-
Fuel Consumption
-
Electrical Consumption
The outputs of the selection matrix are summarised in figure 9, highlighting that delivery via truck is not viable, delivery via the grid may be desirable in the future and that production onsite via electrolysis is the most viable option.

Figure 9 - Outcomes of the Selection Matrix for Hydrogen Source, where green bubbles weightings were desirable outputs, yellow acceptable and red unacceptable. H2 Via trucks is discounted, H2 Via Grid recommended in the future and H2 Via Electrolysis is recommended.
SELECTING THE ELECTROLYSER
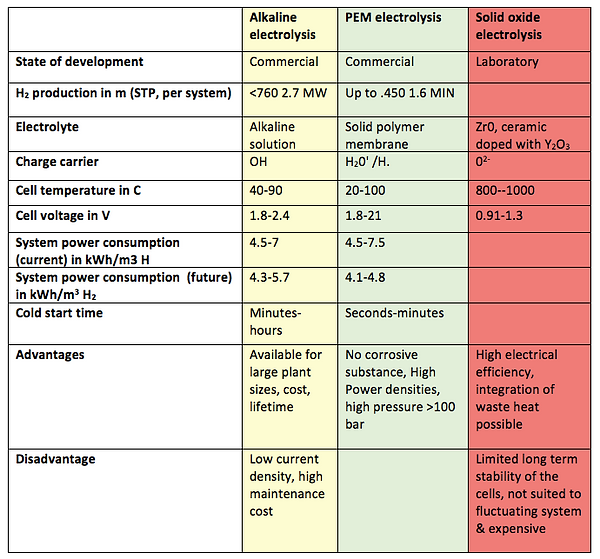
As electrolysis is the most viable source of hydrogen, the type of electrolyzer must be considered. Referring to Table 3, commercially accessible alkaline electrolysers function at a temperature and pressure of up to 90 C and 3 MPa with an output of 760 m3 /h of hydrogen and almost 2.7 MW output. Efficiencies of alkaline electrolysers range from 65 to 70% and are the cheapest in terms of technology development. Almost 65% of the demonstration plants as cited in Refs. (Bailera et al., 2017)(Weidner et al., 2018) are based on alkaline electrolysers. The Solid Oxide electrolyser is still on a laboratory scale, it is not currently being used in any power to gas plant. It has rapid material degradation and limitations to long-term stability that are both due to the high temperature operation (Ursua, Sanchis and Gandia, 2012). The high temperature implies that the product stream is a mixture of hydrogen and steam, which requires extra processing and hence higher capital expenditure(Gondal, 2019). PEM electrolysers are simple in design but with high efficiencies ranging from 62 to 83% (Gallandat, Romanowicz and Züttel, 2017) The application of PEM electrolysers is however limited to a maximum of 30 m3 /h for a single module (Gallandat, Romanowicz and Züttel, 2017). PEM electrolysers are able to conform to rapid changes in load but have a short service life owing to the stability of the proton exchange membrane. PEM electrolysers use platinum as a catalyst and therefore have a higher cost (Gallandat, Romanowicz and Züttel, 2017).
Table 3- Comparison of Alakaline, PEM and Solid Oxide Electrolysers. Information source (Gonal, 2019)
Upon assessment of the electrolyser types, a PEM electrolysis unit is suggested within this scenario, particularly the Nel M 4000 Electrolysis unit (Nel, 2021) , a summary of the system demand and electrolysis unit supply - as calculated in the methodology section -is shown in figure 10.
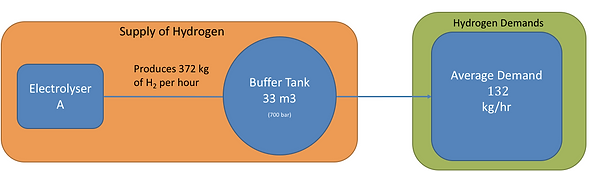
Figure 10- Electrolsysis supply meet Hydrogen Demand for Scenario 2.
ELECTROLYSIS ON CAMPUS
As the hydrogen is chosen to be sourced via electrolysis, finding a location to house the electrolysis unit was key. It is suggested that this is housed at the St Paul’s Building, marked with a yellow star on the map in figure 11. This is just across the road from the Energy Centre marked with the blue triangle, with 100m of pipeline shown in red laid under the road to connect the two buildings.

Figure 11- The location of Electrolyser unit, Martha Street denoted with yellow star, and Energy Centre denoted with blue triangle. Pictures of both buildings shown on the right.

Figure 12- Floor plans (simplified from plans supplied by Strathclyde Estates) to illustrate the layout of the systems within the buildings.
Figure 12 illustrates the floor plans of the St Paul’s building on the left and the Energy Centre on the right. There are two options for housing electrolysers at St Paul's, firstly within the building- here shown the basement level, with appropriate hydrogen detection and health and safety measures. Alternatively, as the building has a flat roof the units could be housed on top of the building in repurposed shipping containers; reducing health and safety concerns. The blue striped box encompasses the size of the electrolysers, purifier and compressor. A hydrogen buffer tank is shown in green. Where the current three 8MW boilers are it is assumed 3 8MW hydrogen boilers would be located. Note that the purple box in the Energy Centre shows the grid gas connection, where in future when possible hydrogen could be sourced from the grid. With future expansion of the District Heat Network, there is room for an additional hydrogen purpose-built CHP and additional electrolyser to support increased demand. As calculated within the methodology, the 2.5m x 2.5m spherical tank holds hydrogen, and supplies extra when demand is above the average. A schematic diagram of the system is illustrated in figure 13.

Figure 13- System of Electrolysis feeding Hydrogen for the CHP and 3 Boilers which Generate Heat for the DH Network.
USE OF WASTE OXYGEN
The electrolyser produces H2 and O2, the waste oxygen has the potential to be sold, creating a revenue of income for the University. Potential customers include process plants and medical industries. An analysis of the oxygen produced from the electrolyser for potential sale was undertaken.
As per Nel M 4000 online data sheet (Nel, 2021) the production rate of hydrogen is 372 kg/hr when efficiency is 62%. The required power of this per hour is 20 MW.
-
8.9 liters of water is required to produce 1kg of Hydrogen.
-
For every 1kg of Hydrogen produced, 0.5kg of Oxygen is also produced.
The relationship between the efficiency of the electrolyser and the quantity of Hydrogen produced is illustrated in figure 14. (Harrison et al., 2010)(Anzeige, 2020)
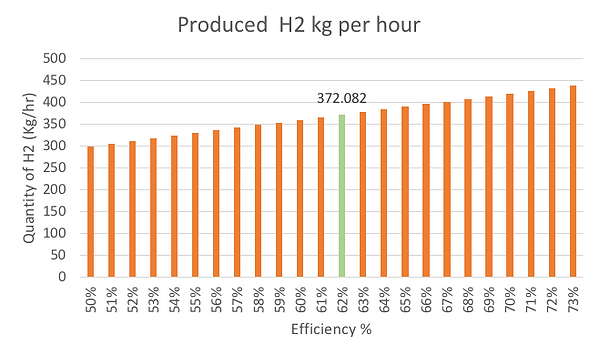
Figure 14 - The Hydrogen produced in kg per hour, for varying efficiencies. An efficiency of 62% has been assumed throughout this project. The mass of oxygen produced in one hour is therefore 186kg.
A cost analysis of the potential revenue for an hourly production of 186kg of oxygen has been undertaken and is detailed in the financial assessment section of the project.
VALIDATION WITH energyPRO
Calculations of the hydrogen and oxygen produced have been validated with energyPRO and online calculator (Harrison et al., 2010) (Anzeige, 2020) For detailed analysis please refere to the available download “Hydrogen Excel Model”. Figure 15 illustrates the simulation within energyPRO.
energyPRO requires very accurate half hour District heating demands data, the meter reading data received is not accurate and often contains gaps, therefore is not a reliable input for energyPRO. To overcome this and still validate the calculated results, a one month sample where there were minimal meter reading data losses of January was used. The output of the energyPRO simulation provided results that were within 0.72% accuracy to the results calculated using excel. Figures 16 illustrates the excel sheet output and energyPRO output.
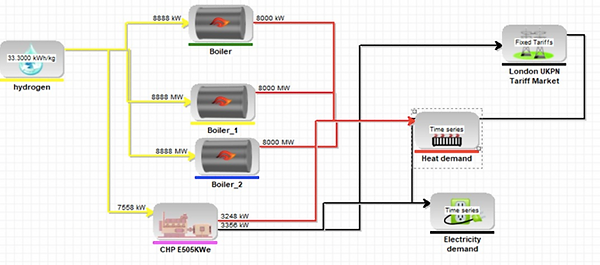
Figure 15- Schematic of Scenario 2 Simulation within energyPRO.
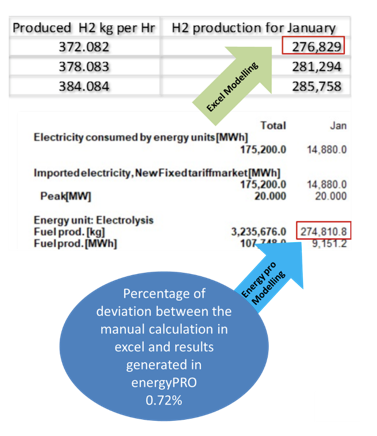
Figure 16- Results of Validation Experiment with energyPRO, showing the calculated result for Excel modelling in green and energyPRO in blue. Giving a 0.72% deviation in results- proving validity of excel modelling.
Scenario 3
Scenario 3 is a hybrid system comprising of components from both scenario 1 and scenario 2. In this case, WSHPs will be replacing the hydrogen boilers in scenario 2. The 3.3 MW CHP system is fed by an electrolyser producing hydrogen fuel and this alone is capable of providing 41% of the annual energy demand of the university. The boilers have been replaced by two 3MW WSHPs and these bring the percentage of annual energy demand provided by the system to 97%. The remaining 3% of annual energy demand will be met by a 185,000L thermal store, sized as described in scenario 1. Figure 17 illustrates the % of demand covered by each component and table 4 details the parameters of the system. When considering environmental impacts for the hybrid system, those identified for scenario 1 and 2 are both applicable.
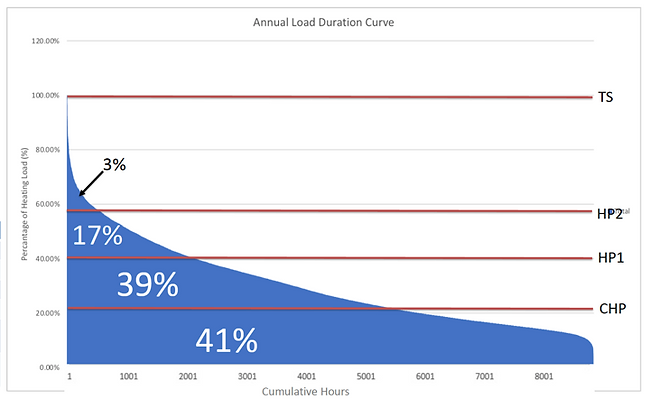
Figure 17- Annual Load Duration Curve for Scenario 3, detailing the Percentage of Heating Load met by the Hydrogen CHP, the 2 WSHPs and the thermal store.
Table 4 - Parameters of Scenario 3.

Future Demand Consideration
A potential demand reduction was modelled as one of the next steps. For this we assumed, the University could achieve an 85% reduction in residential buildings and a 70% reduction in commercial buildings, through the implementation of passive house retrofitting. The University has buildings such as the Royal College on campus that would struggle to achieve this reduction due to the age of the building. An in-depth analysis of the building and its potential reduction was out with the spec of this project; therefore a 70% reduction was taken across all commercial buildings on the campus.
The potential reduction in demand would allow the proposed system to have the surplus capacity as illustrated in figure 18 this would give the university the scope to add buildings to the network. The purple circles in figure 19 mark buildings the university have proposed as potential new connections to the system. The expansion of the district heating network would grow the universities partnerships and potentially allow them to sell the heat to generate money.

Figure 18 - Prediction of demand reduction with passive house retrofit of Buildings within the Campus, creating surplus capacity for future connections.

Figure 19 - Location of various phases of the DH network, the blue bubble encompassing phase 1 and the current system, phase 2 shown in red. Purple bubbles highlight potential areas for connection within Phase 3. Base map annotated from snazzymaps.com